Enter password to view case study
Undergraduate Capstone Project, Fall 2025
Vector Illustration Design for Software Product Interfaces, supporting Dell's Infrastructure Solutions Group (ISG) through visuals.
At the end of my capstone project, I presented at the Dell Roundtable to about 40 members of the Experience Design Group. The project and the presentation itself received encouraging feedback, and there was interest in its potential to evolve into future work, possibly as my graduate capstone in Spring 2027!
The slide deck has been converted to PDF for web-hosting and does not support video, the video walkthrough from the presentation is below.
Video Demo
Project Background
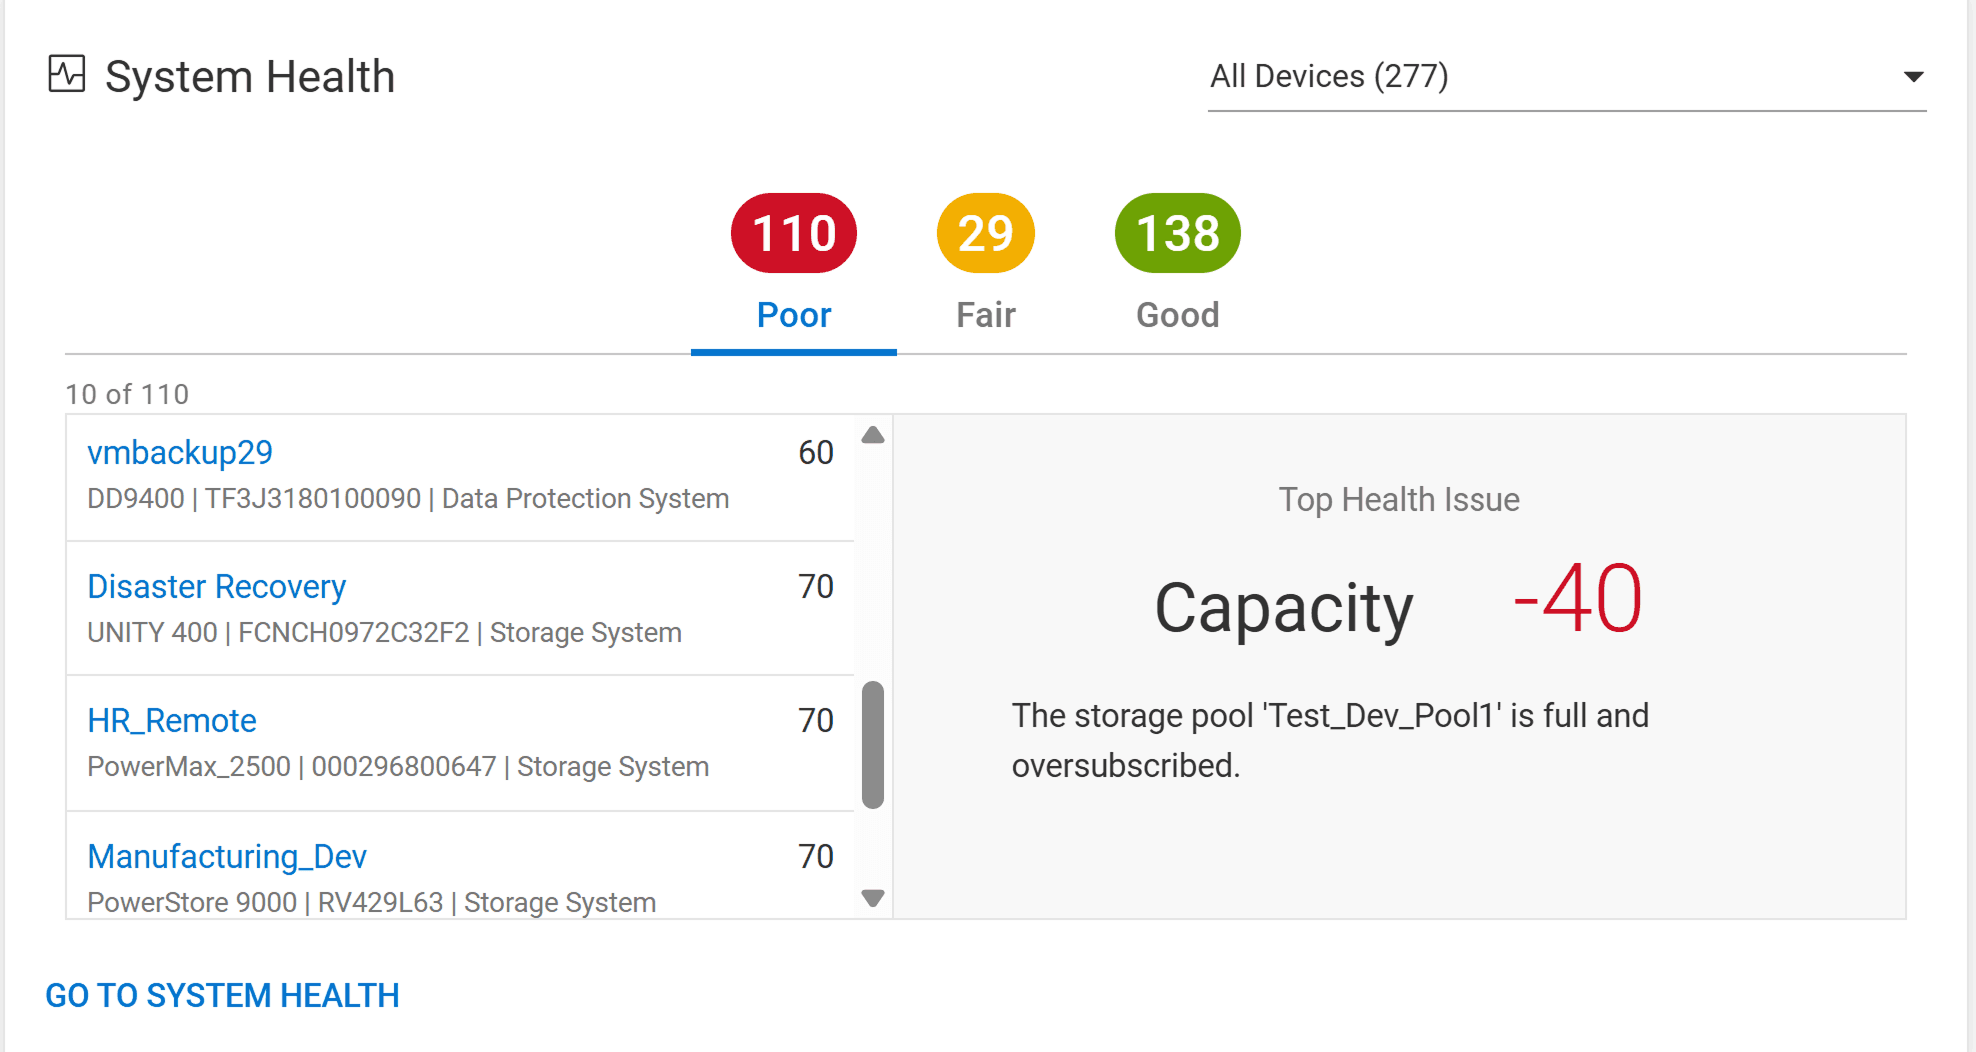
ISG tools manage complex infrastructure made up of servers, storage, and networking.
Presently, this information is only displayed in tables. This makes understanding spatial and networking relationships difficult, and not user-friendly.
Process
Interviews
I conducted interviews with 6 Dell UX Professionals across research, engineering, and design. I wanted to understand what visuals could better support them and their workflow, and where exiting visuals currently fall short.

Non-Dell example imagery, provided by interview participants.
These interviews distilled into several main themes:
Existing visuals aren't always enough - they can communicate what exists but not where or how things are connected.
Speed and flexibility matter - teams want something that fits into their existing workflow and gives them a quick and low-pressure way to communicate ideas that still feel consistent with the Dell design language.
3D-inspired visuals would provide more clarity, and serve as a delightful way to view networking systems.
Early Sketches

Using these themes as a guide, I explored early concepts across pencil sketches, Procreate, and Shapr3D. These iterations helped me visualize possible solutions, test depth, alignment, and grid structures, and identify what could form a modular system.
I brought these early idea into a second round of interviews to confirm alignment with the original wants and needs and refine the direction.
Refining Stakeholder Needs
The second round of interviews confirmed the direction of the project was in alignment with what they had envisioned, and several main themes emerged that clarified the main stakeholder needs.
Multi-level clarity
Teams wanted to move smoothly from a high-level environment view into racks and then into individual devices. This confirmed the need for both a bird’s-eye view and detailed drill-down states.
Visual differentiation
They needed clear indicators for onboarding status, device states, and Dell versus third-party hardware so that the visuals communicated function without relying solely on text.
Clustering
Racks needed a meaningful way to be grouped by physical or logical proximity. This insight directly shaped the introduction of “rafts” within the system.
Iterative Illustrations
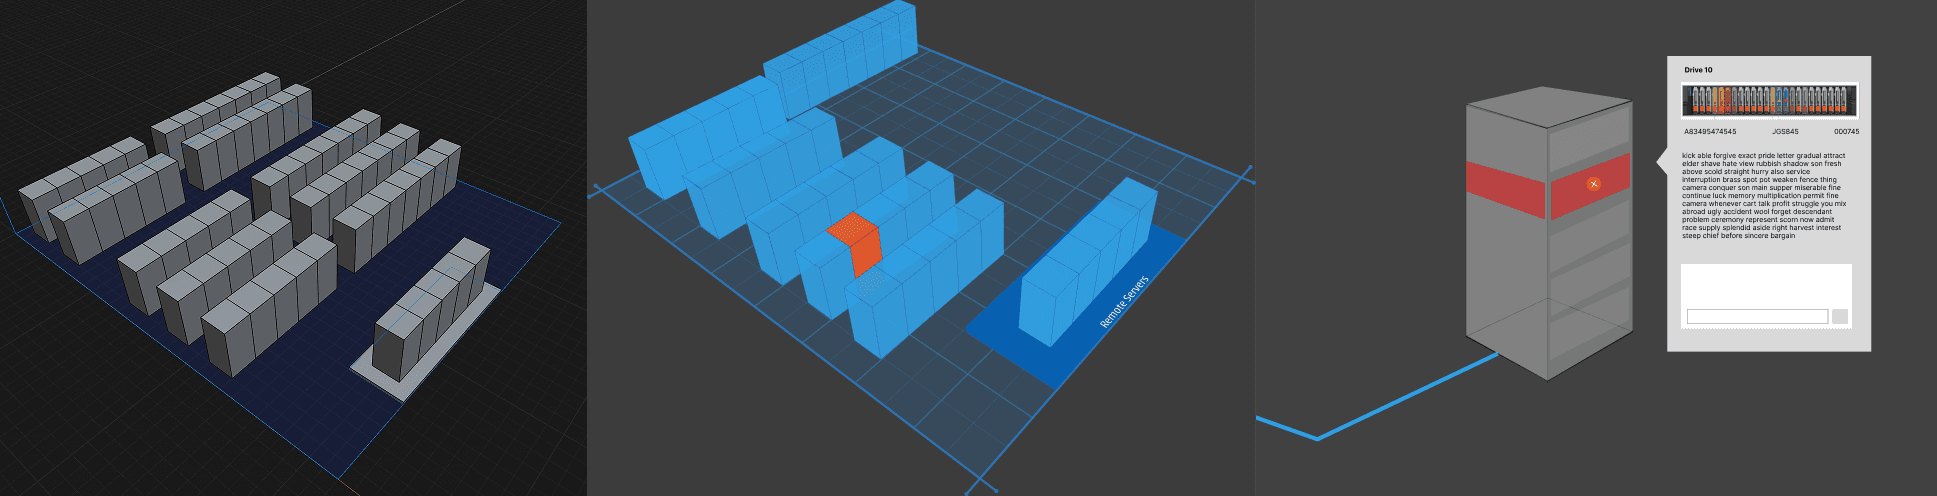
Following the second round of interviews, I refined the illustration system to align with the confirmed needs. I moved to a true isometric perspective to support modularity, introduced rafts for physical and logical clustering, and created front-view overlays for deeper device inspection. These changes made the system clearer, more scalable, and better suited to ISG workflows.
Outcome
The final result is a modular isometric illustration system built to make complex infrastructure easier to understand. The library includes racks and half racks, rafts for clustering, isometric grids, connection patterns, perspective labels, and front-view device overlays. In total, the system contains more than 140 variants across eight component categories.
Everything is designed for quick assembly in Figma, which fits into exisiting workflows and helps teams communicate ideas faster.
Aligning with Stake Holder Needs
This system supports ISG teams in several key ways:
From tables to spatial clarity The visuals make layout, health, and relationships immediately understandable, reducing the cognitive load created by long tables.
Accelerates communication
Visuals help teams explain complex networks faster, and modular assets allow quick assembly without relying on improvised sketches.
Scales across teams
The system’s variants allow it to fit a range of ISG workflows, and its modular structure makes it easy to expand with additional isometric assets.
Key Learnings
Pivot when needed
My early 3D attempts were not scalable, stepping back and reevaluating allowed me to shift to isometric perspective which unlocked true modularity.
Design for spatial clarity
Clarity comes from representing real hardware relationships, not just creating polished visuals.
Integrate new visuals thoughtfully
I learned how to design within an established system and create new visuals that extend the language without disrupting it.


